
Our scouts collect ACP population counts from across the RGV daily. We input this information into maps to help grove managers best plan their ACP treatments. Below are detailed maps and descriptions about ACP populations in your area. The maps below are sectioned into zones. Click on the zones that you want to view the information up close. How to read the maps is described at the bottom of this page.
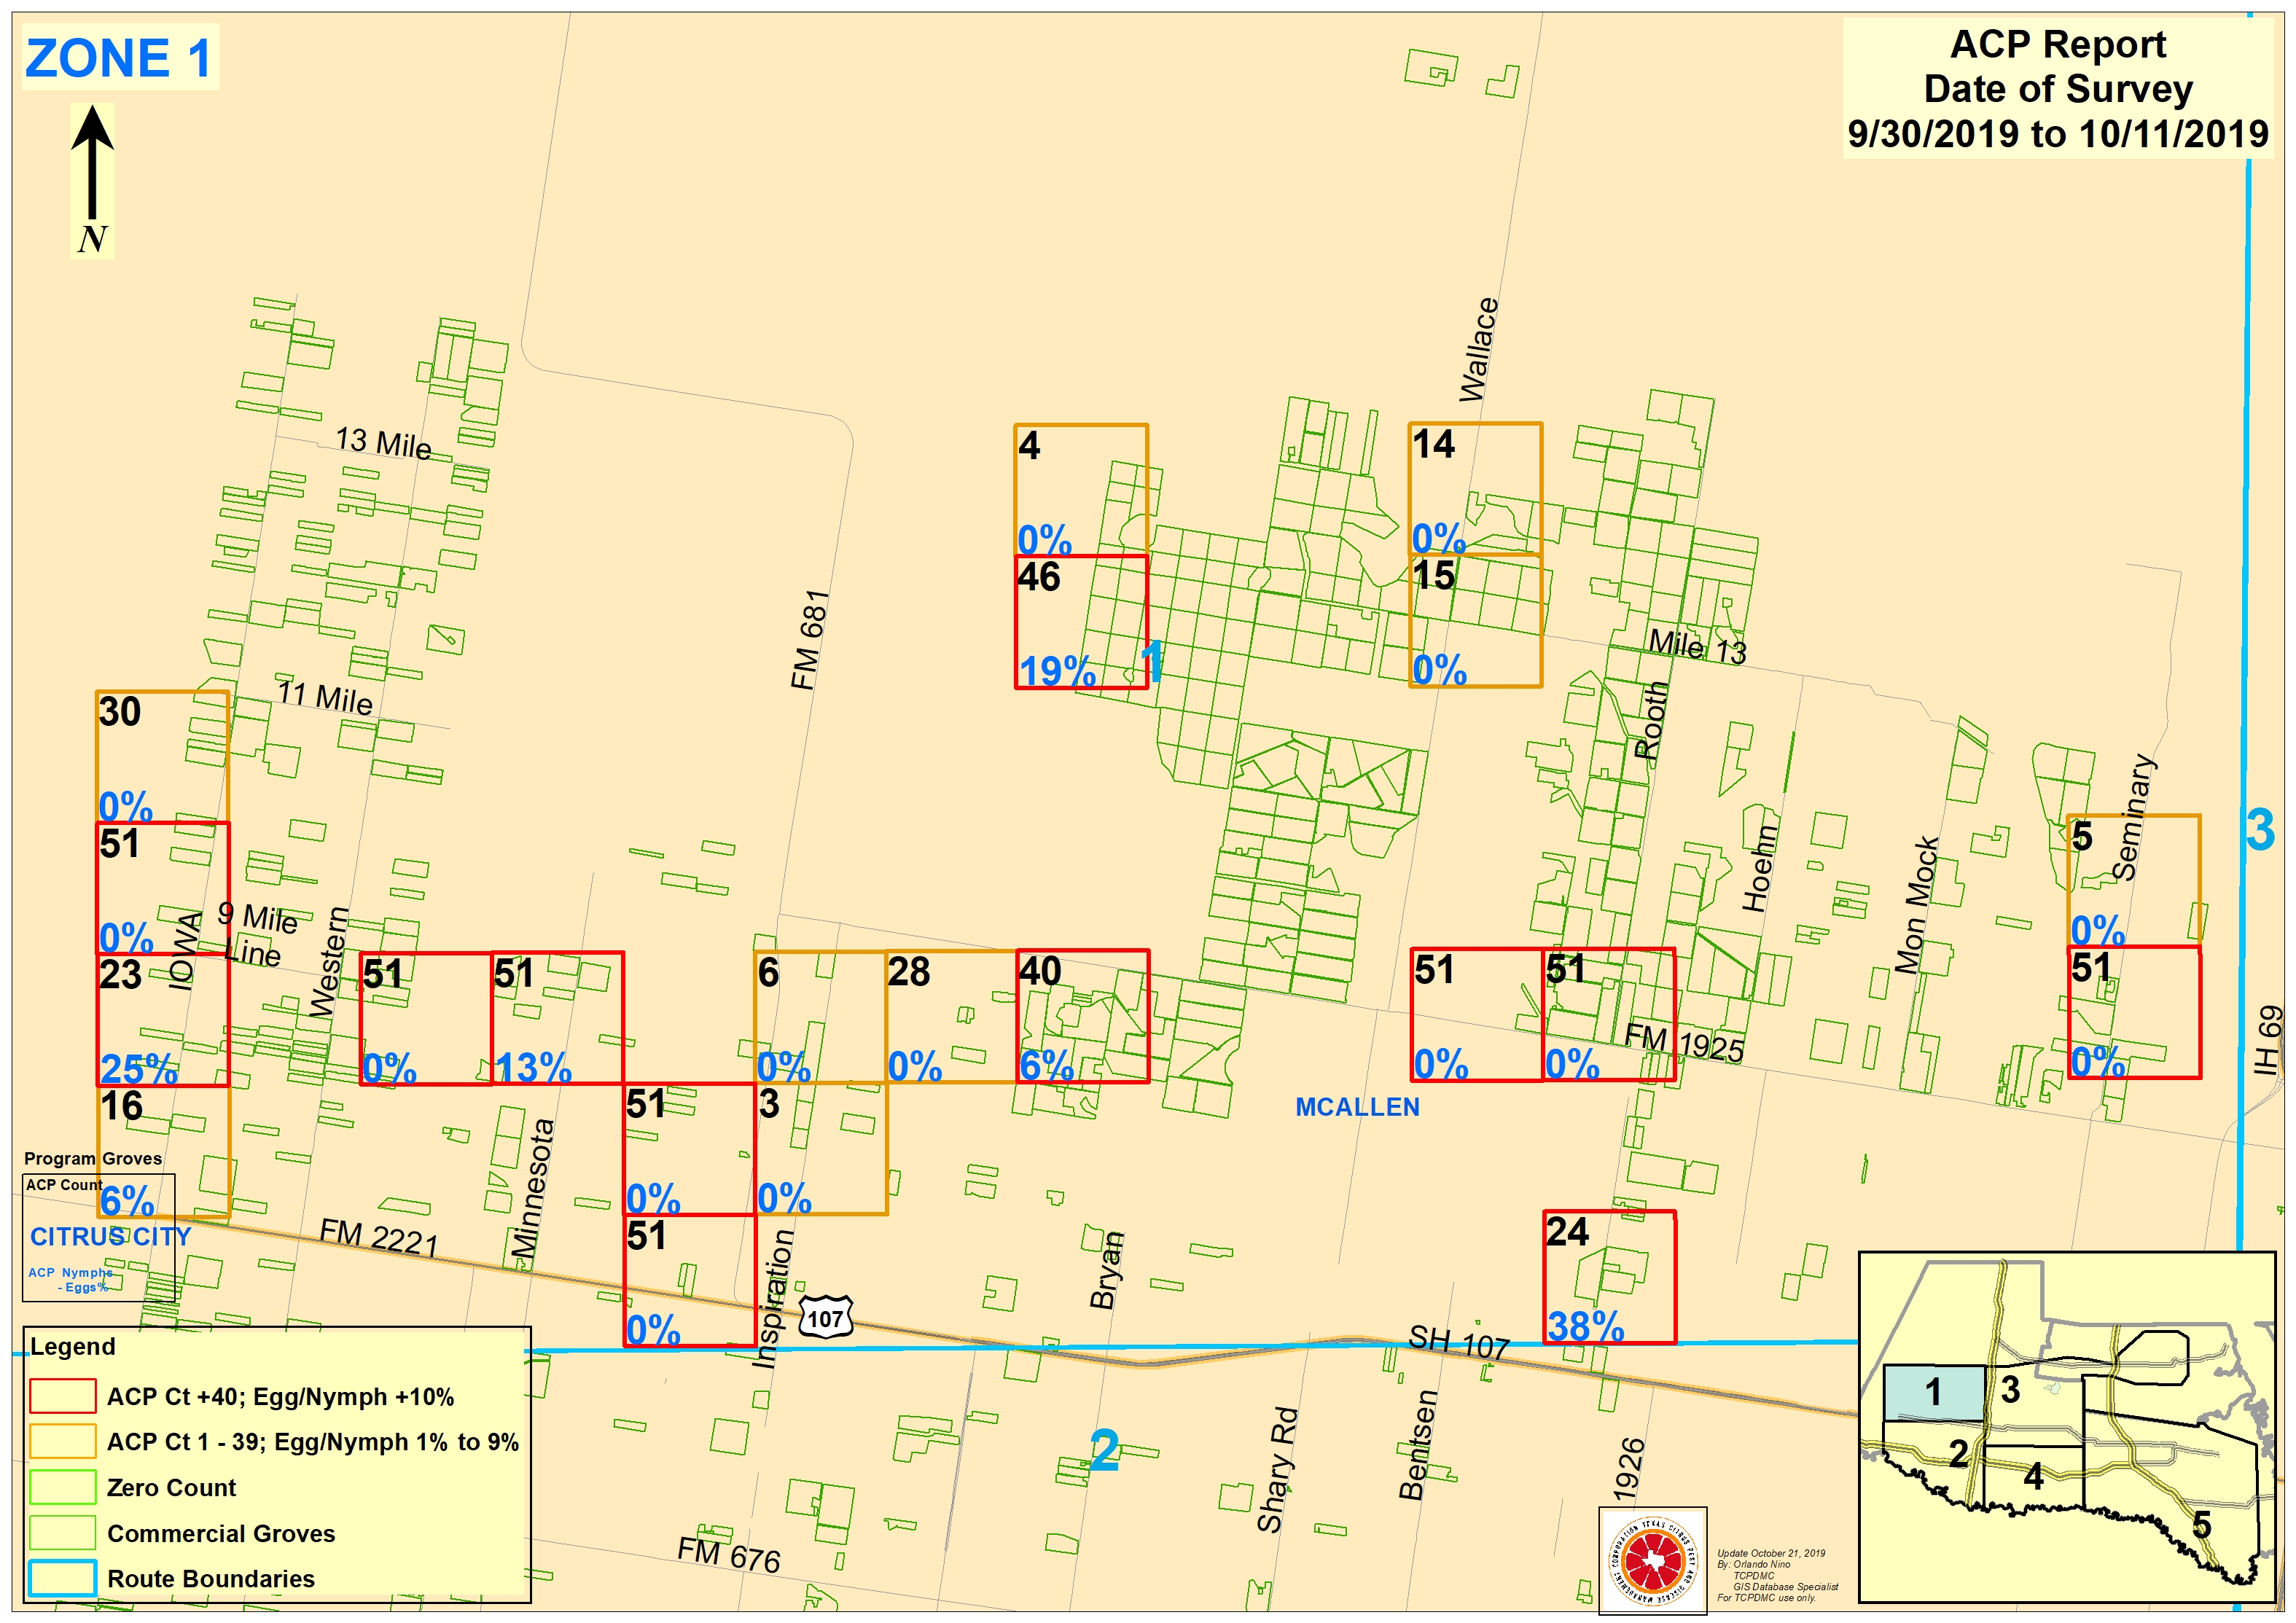
ZONE 1
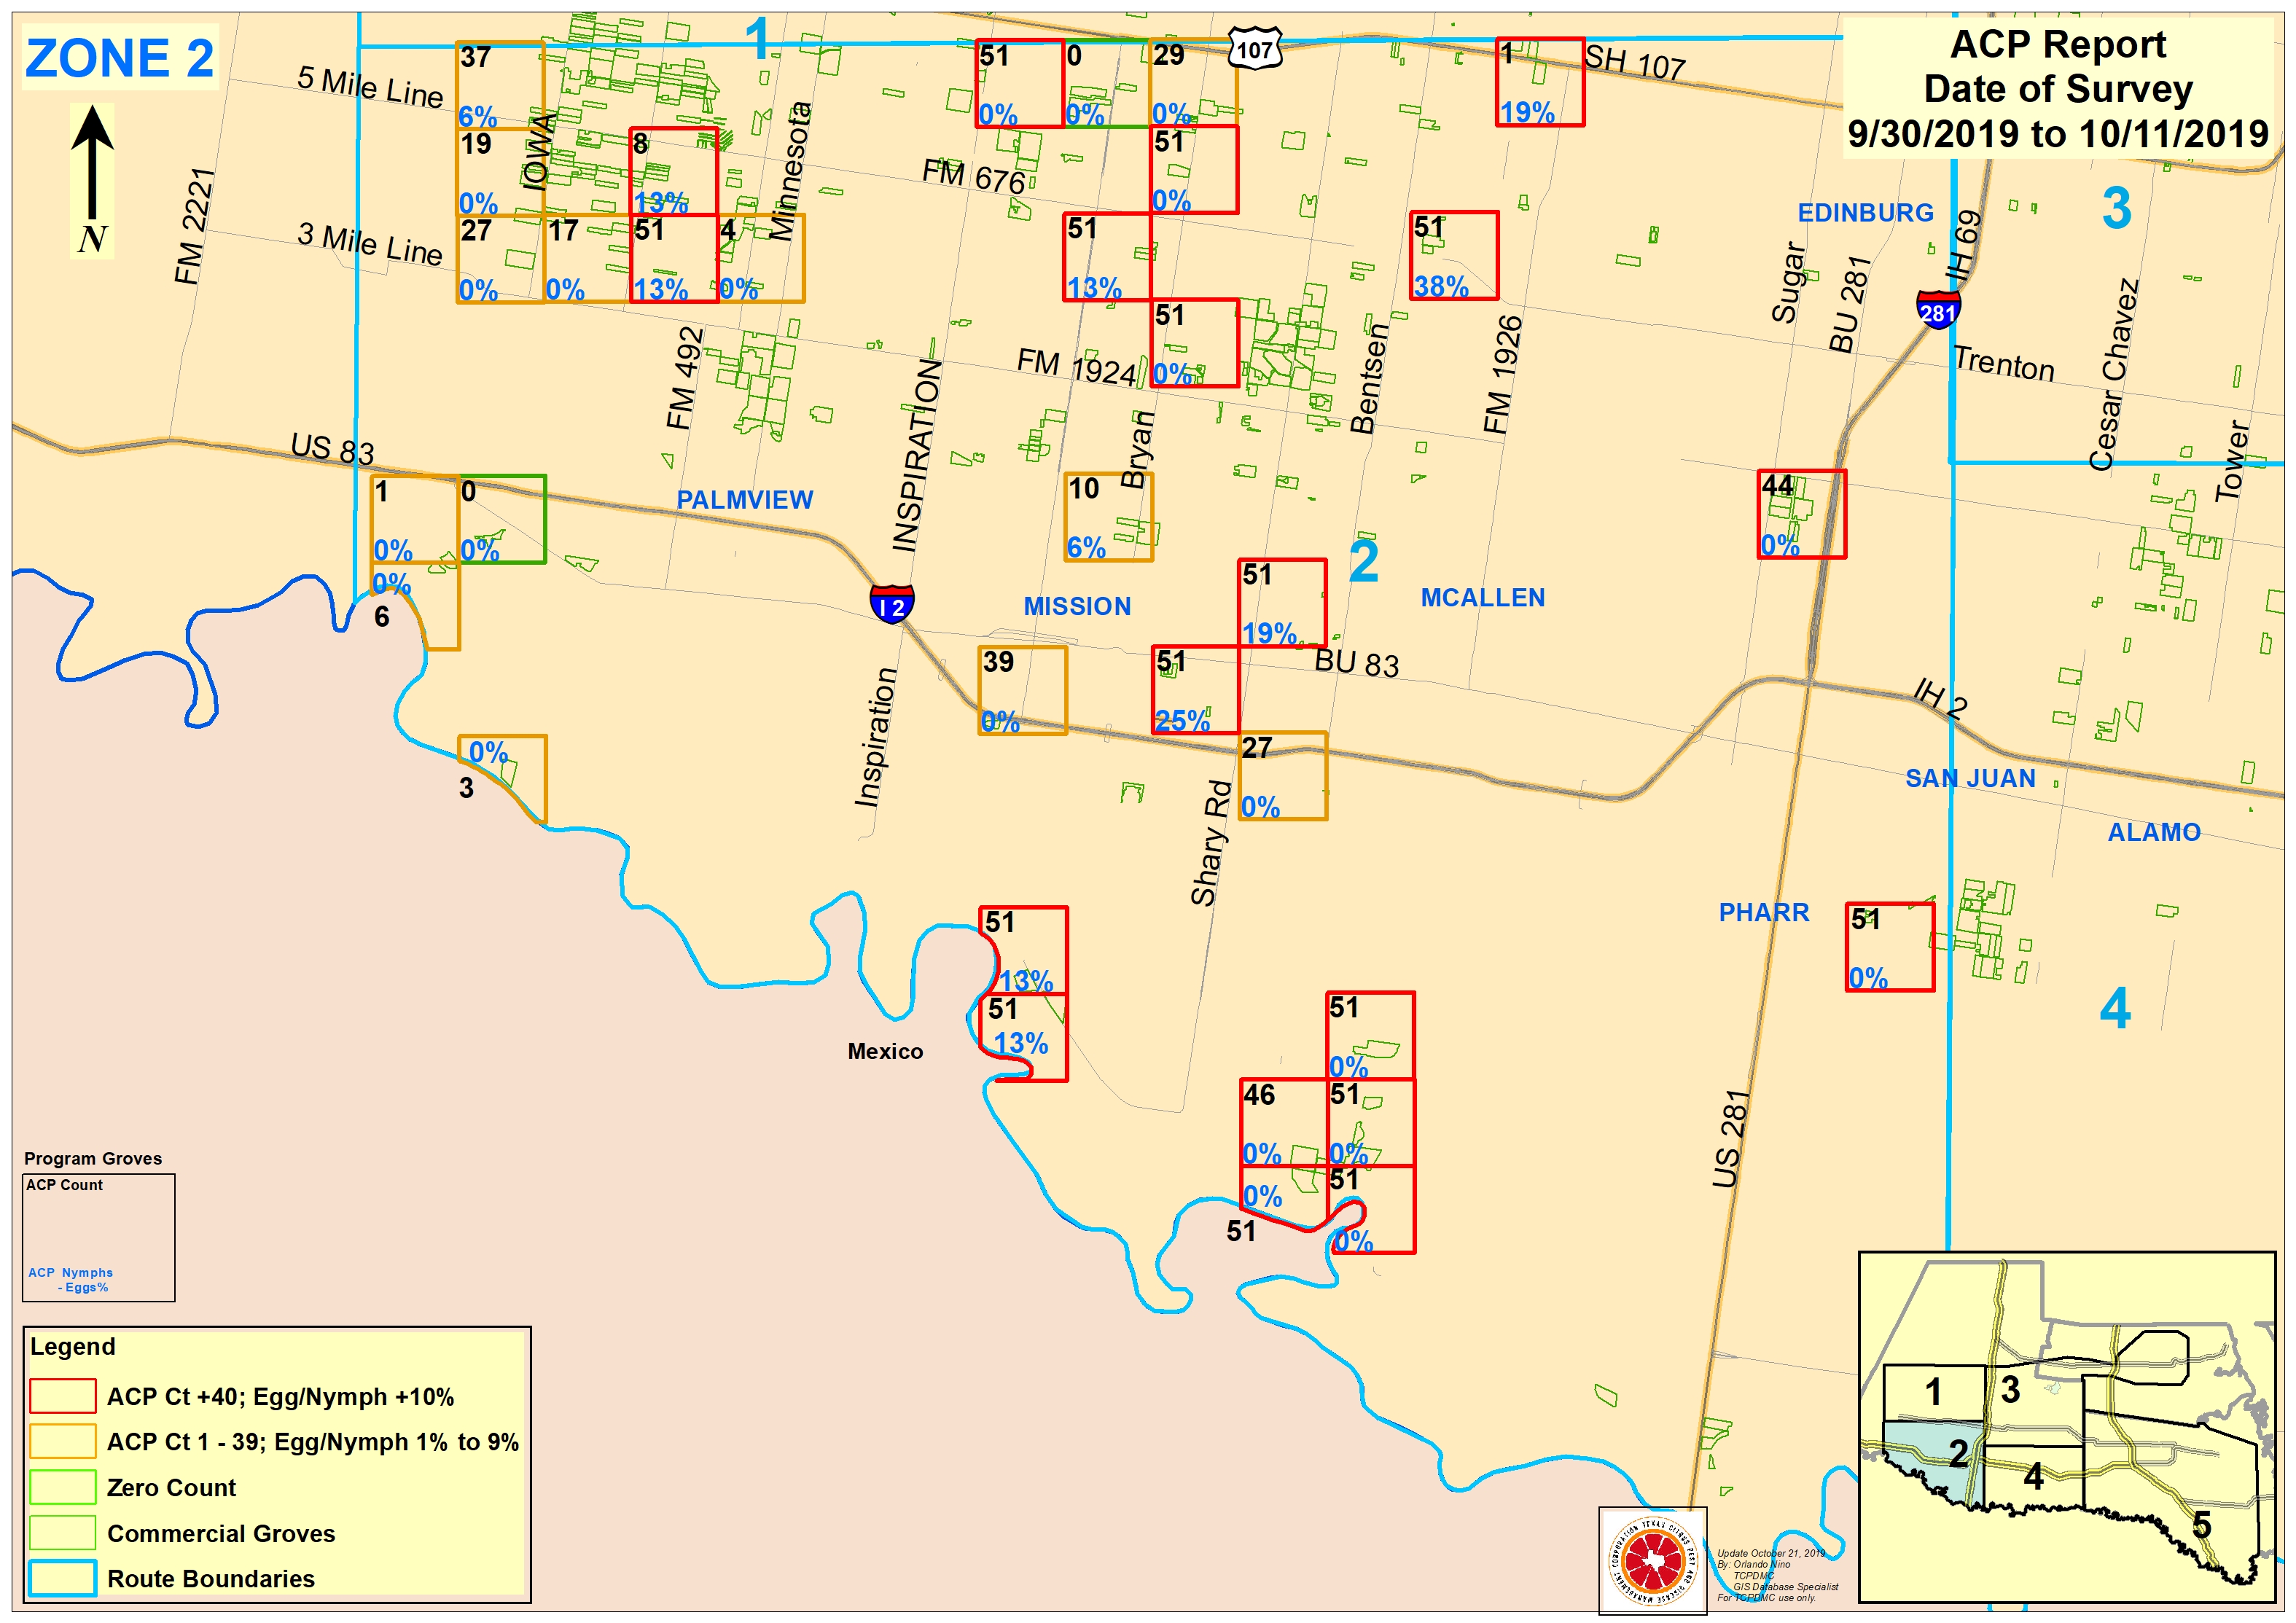
ZONE 2
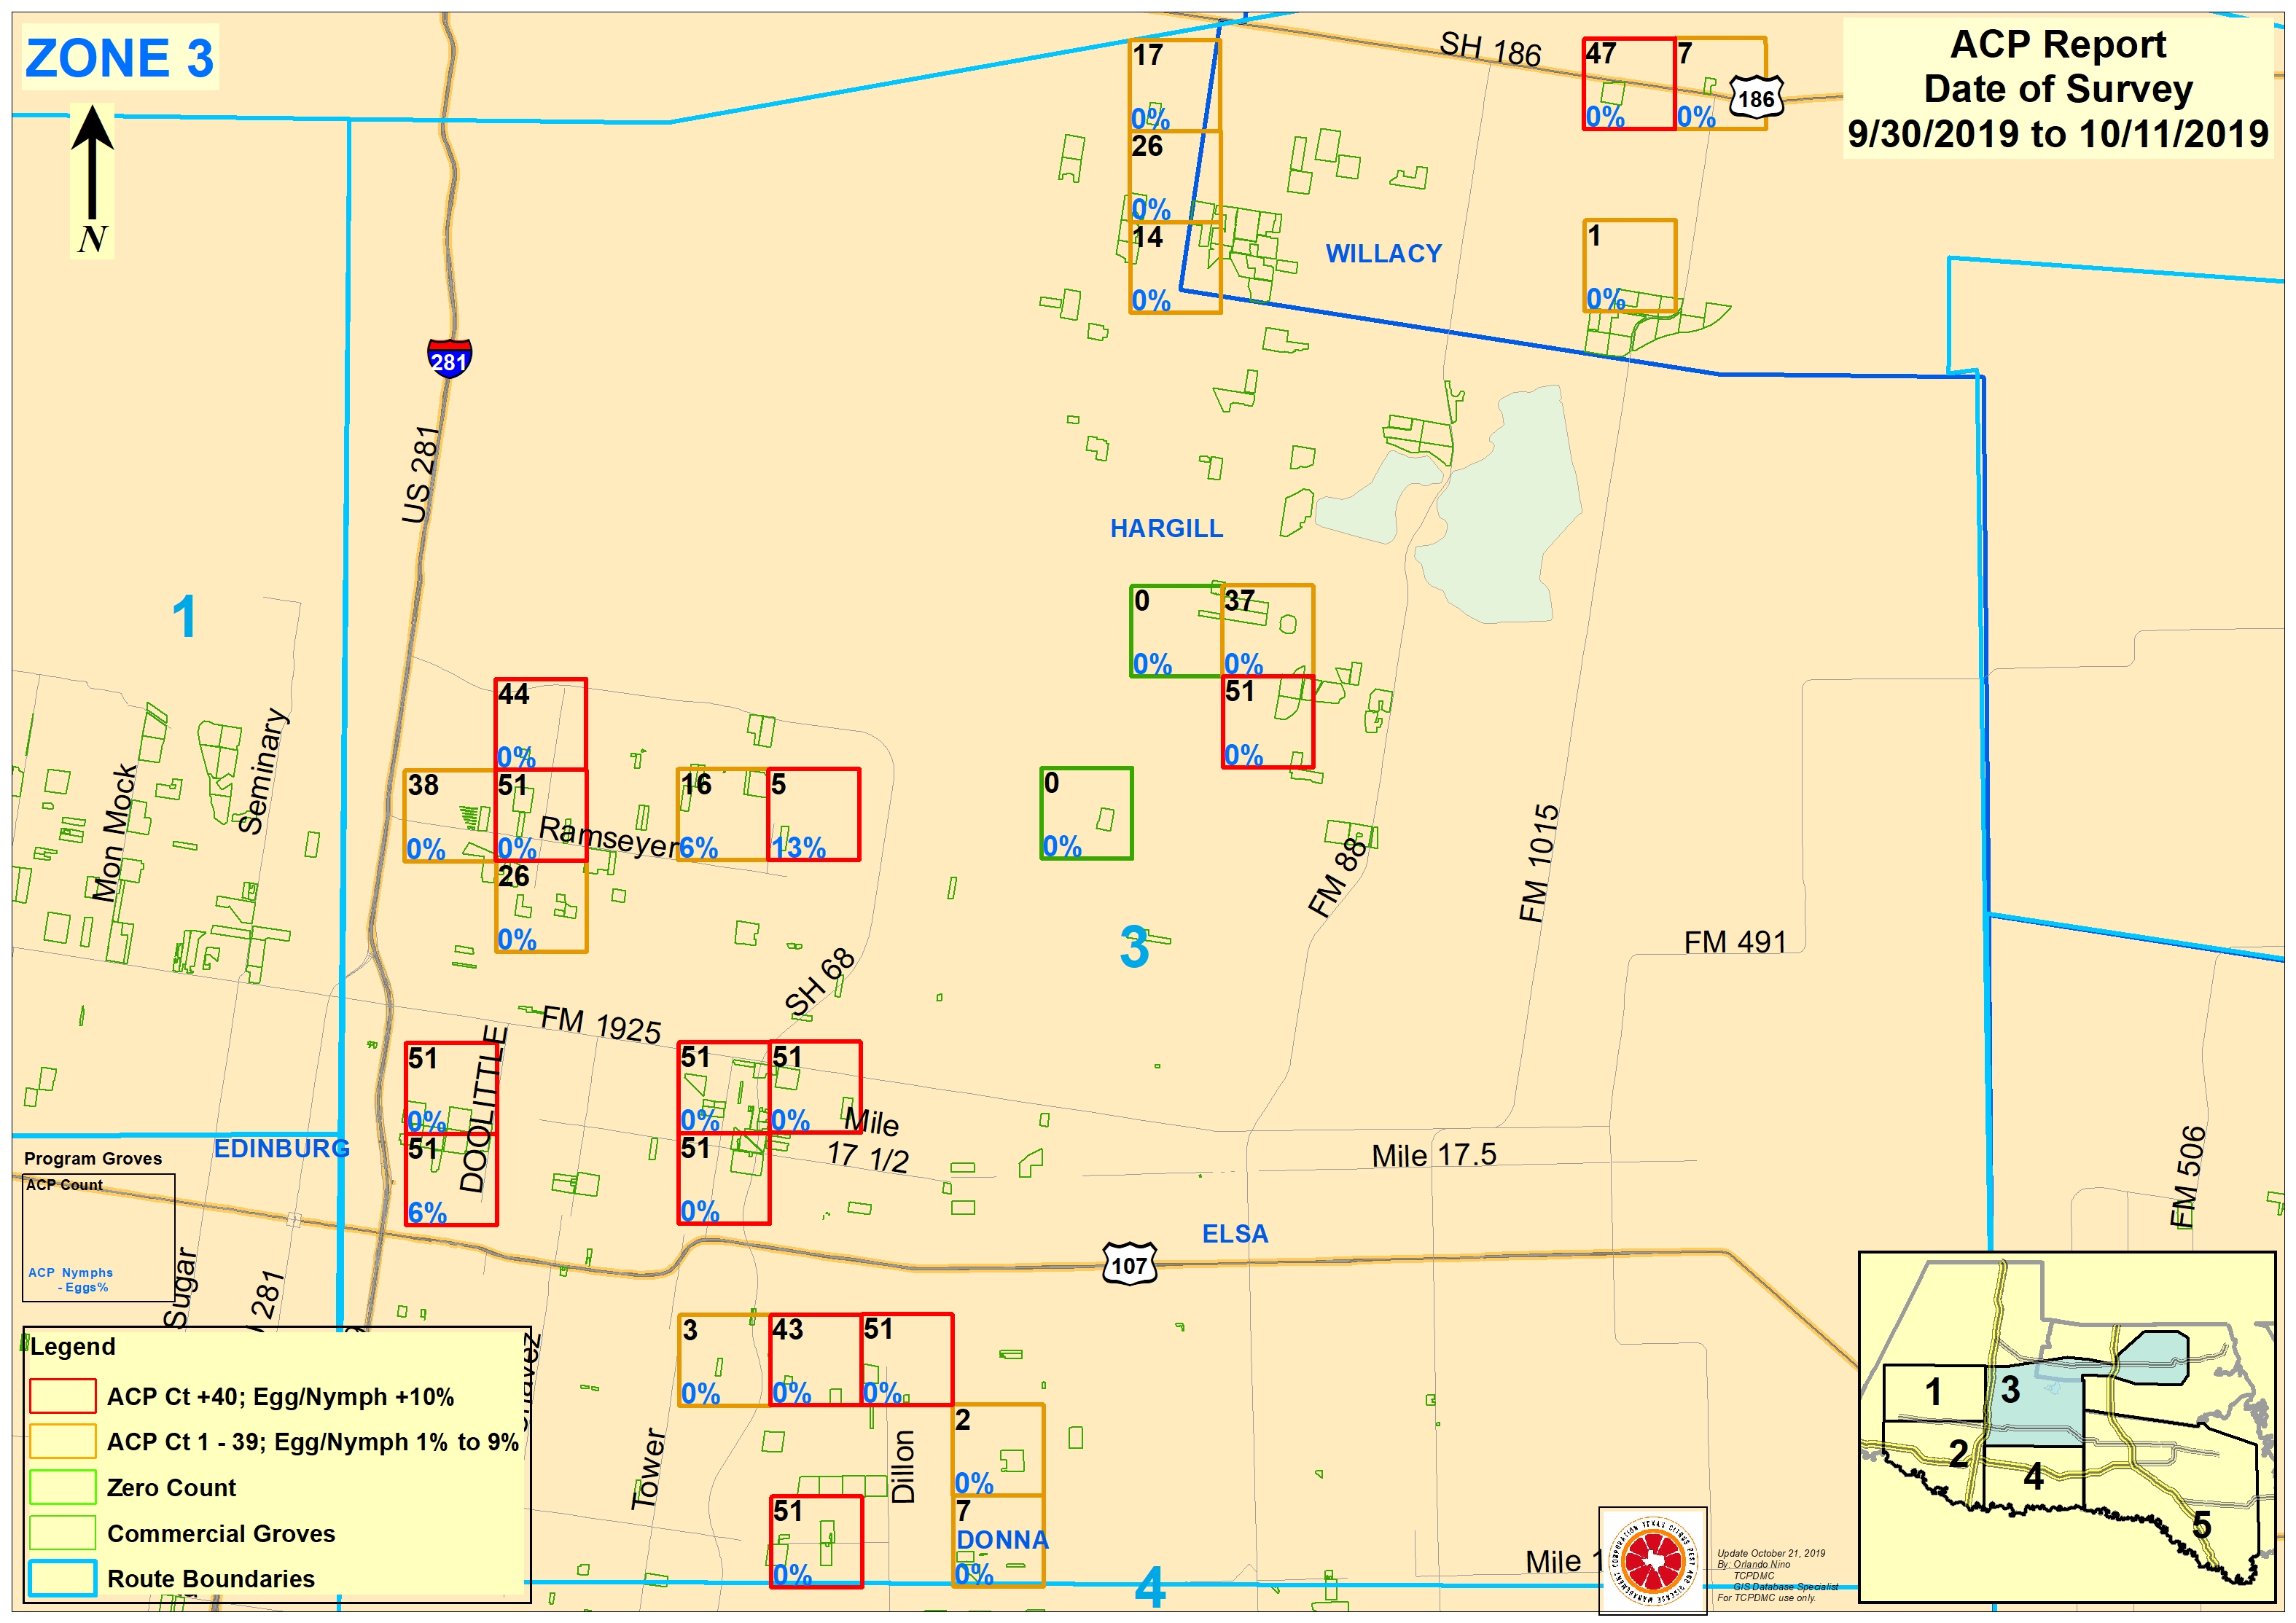
ZONE 3
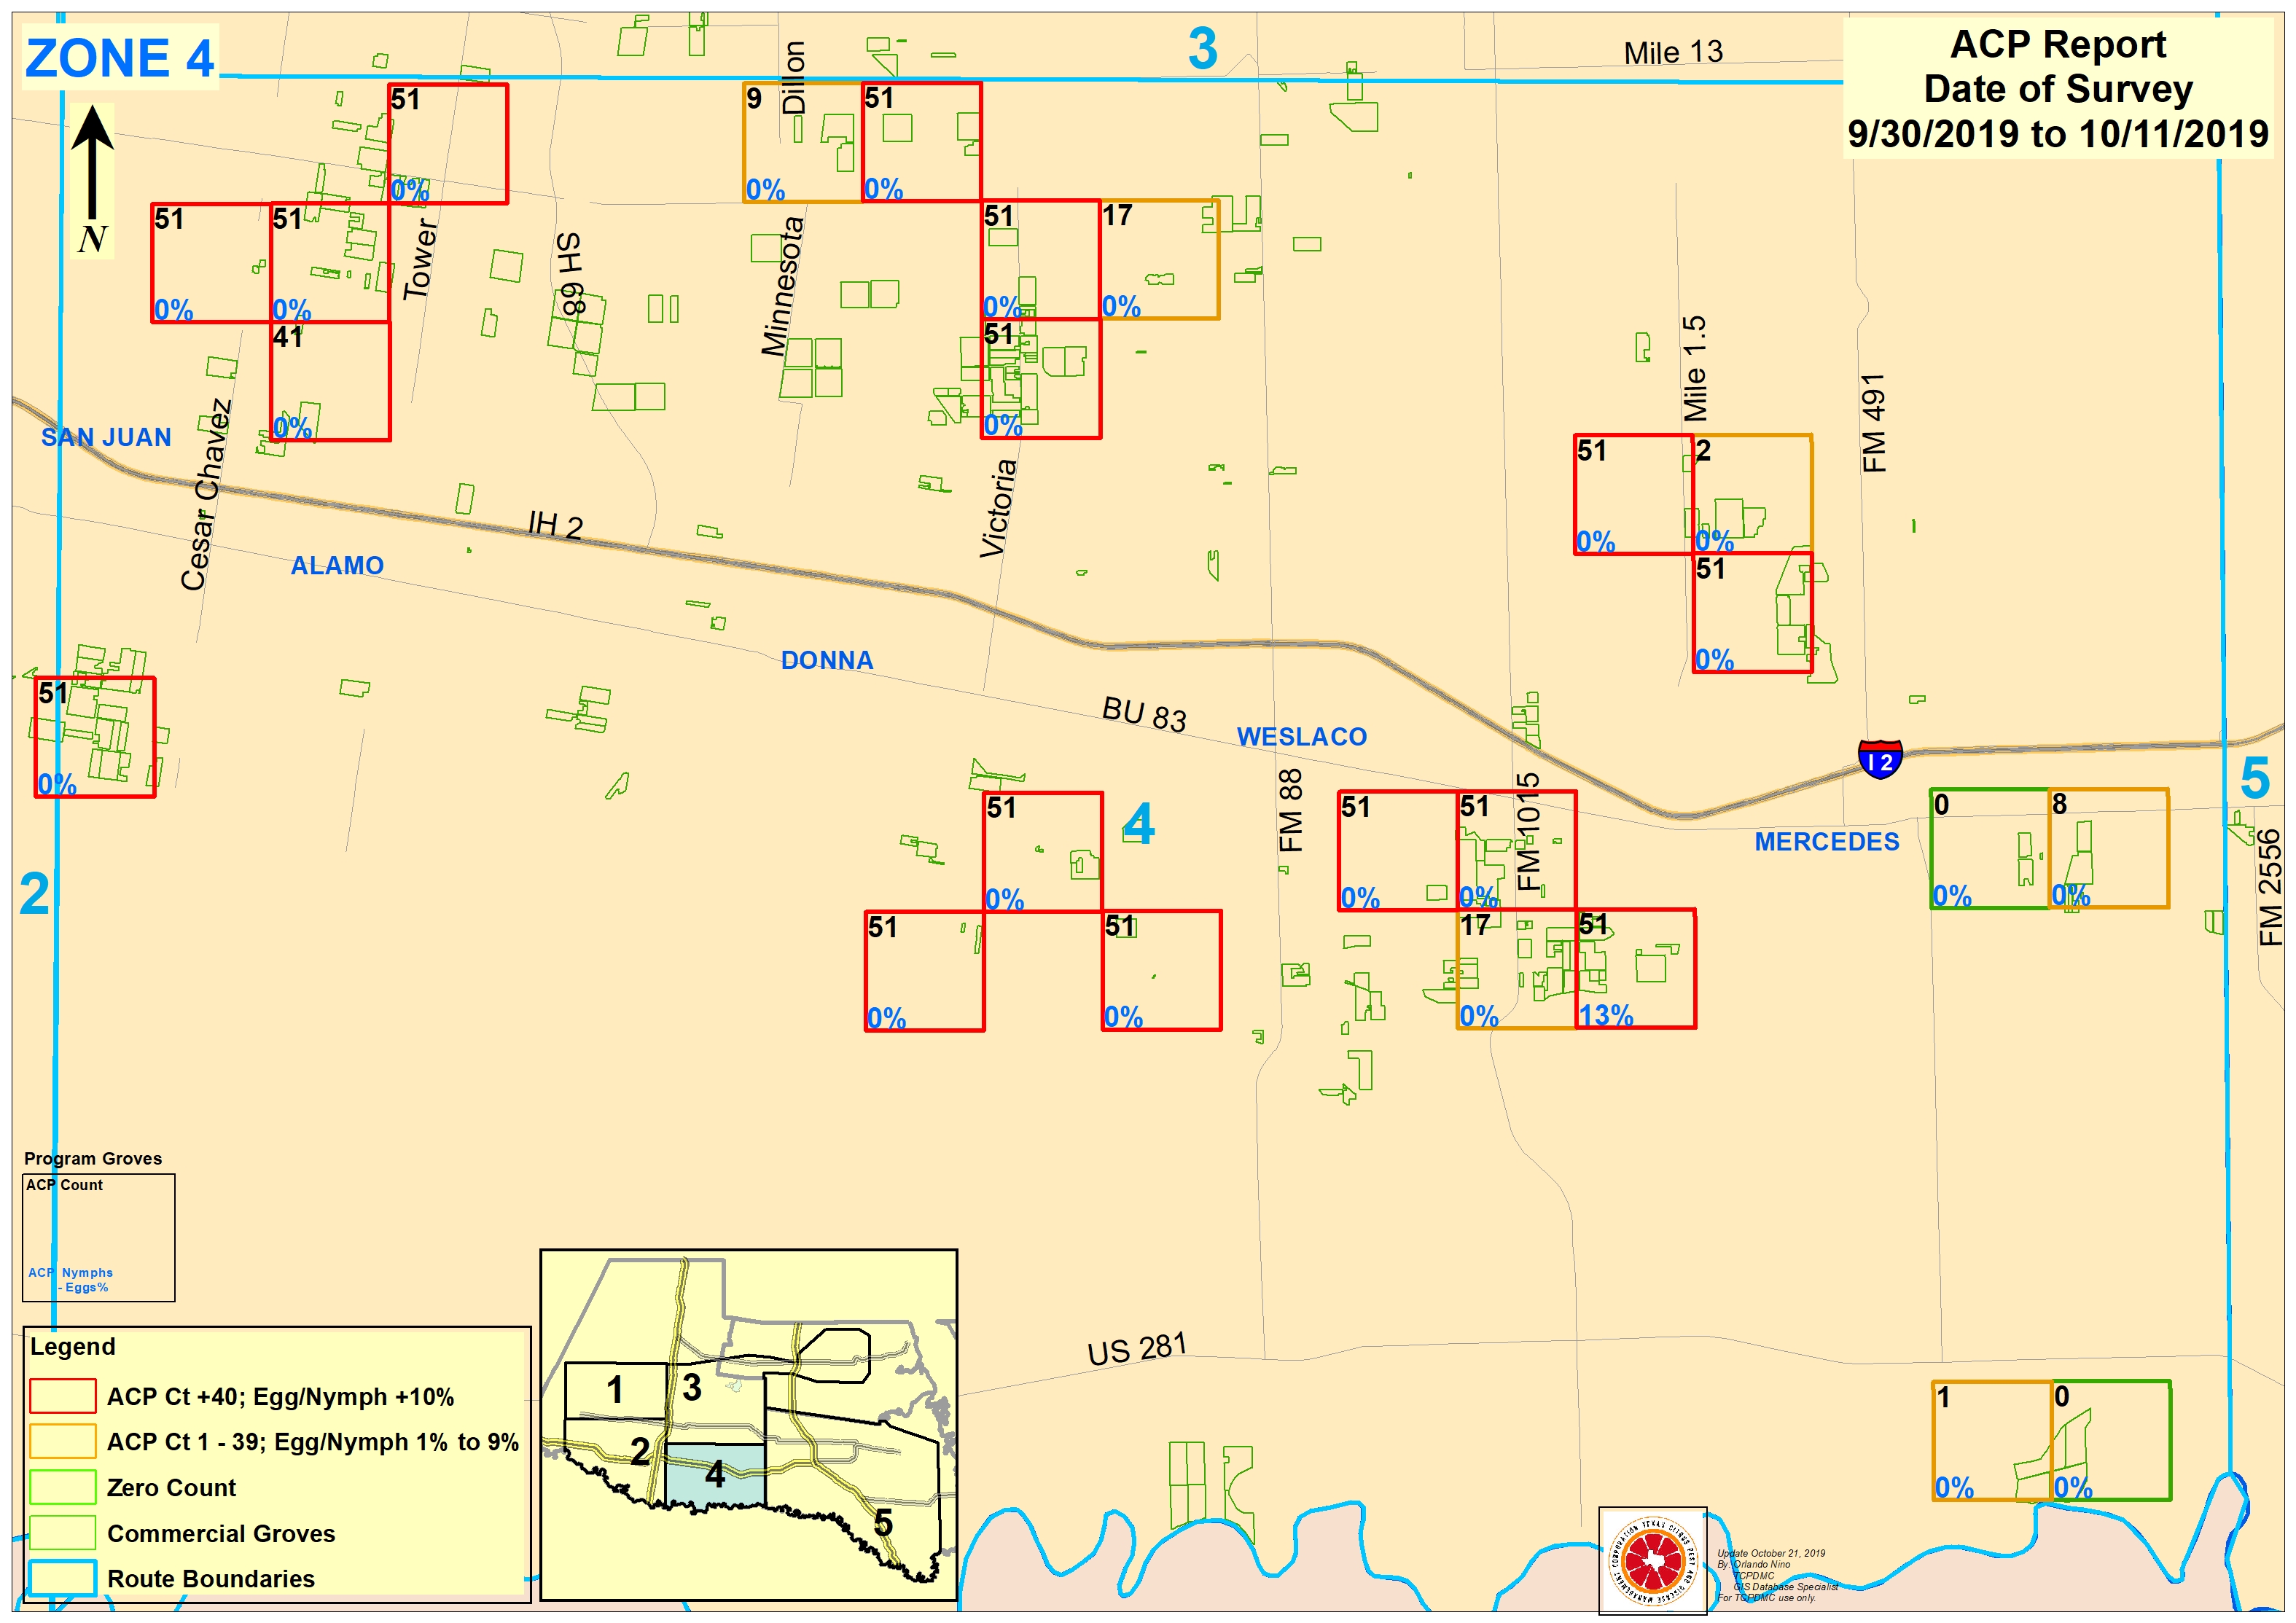
ZONE 4
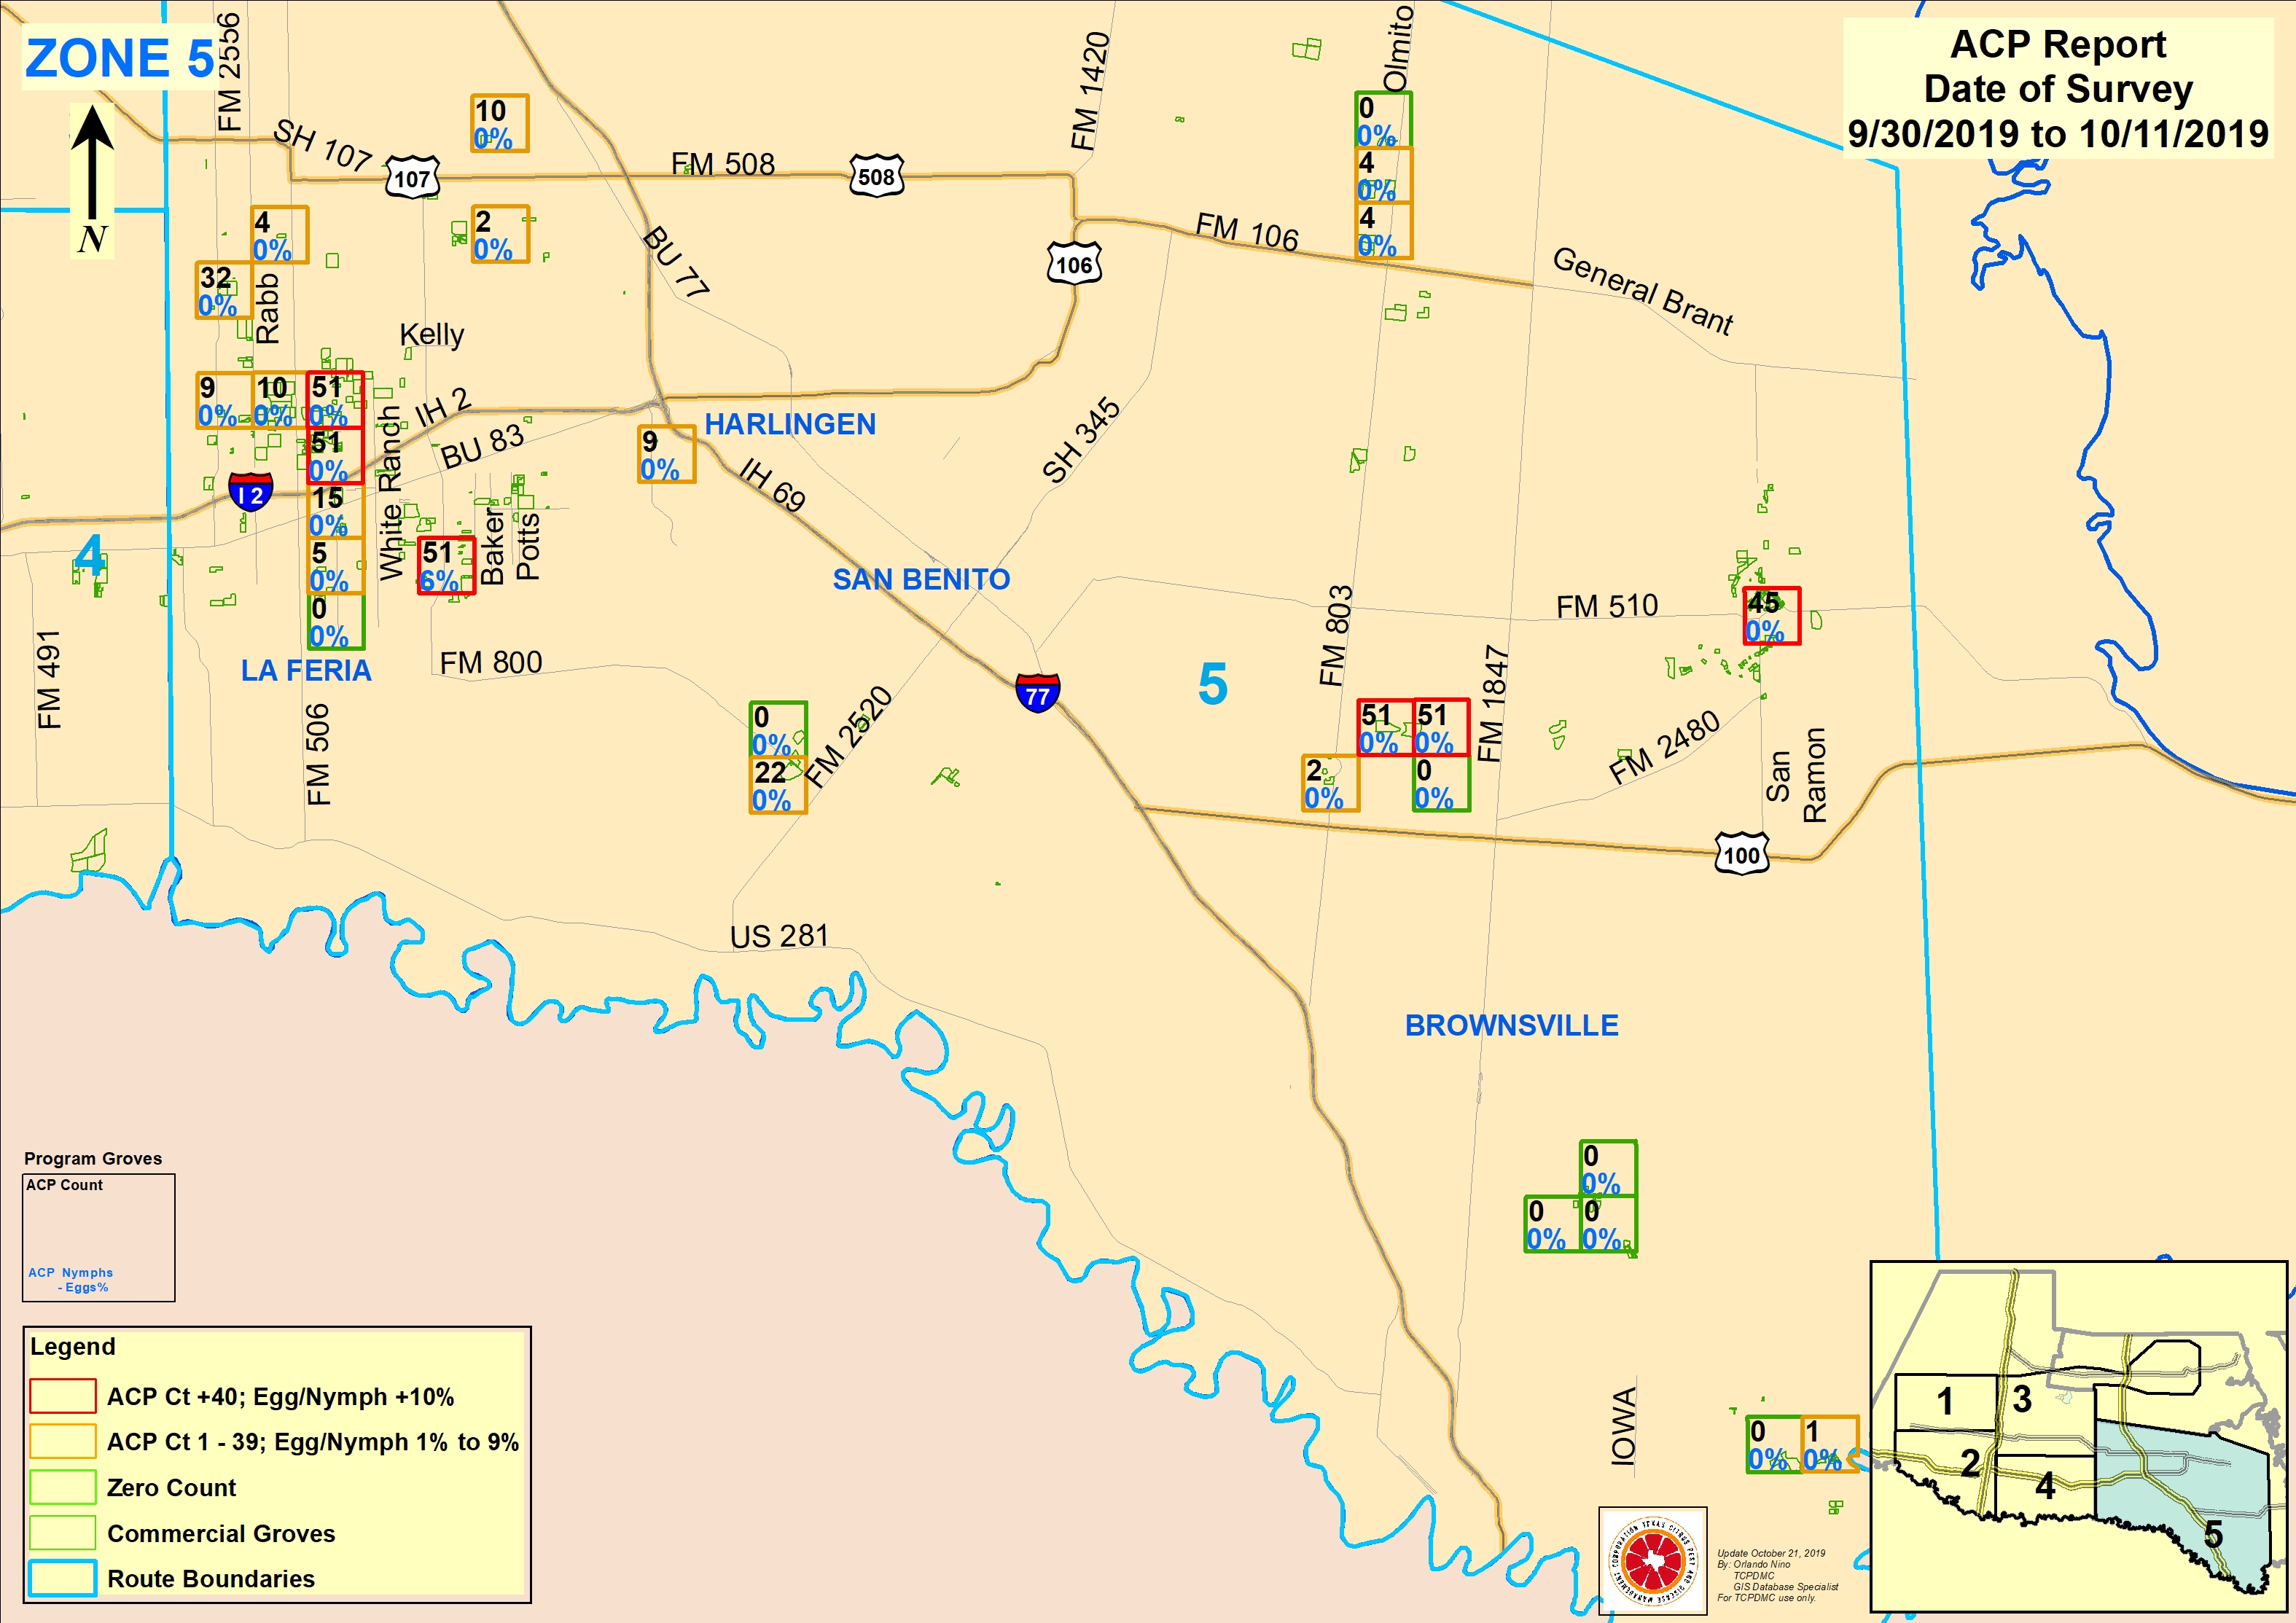
ZONE 5
HOW TO READ THESE MAPS
Each box is 1 square mile in an area and we are surveying at least 1 grove inside each box for that 2 week period.
INSIDE EACH BOX: the BLACK number in the top left corner represents the highest individual ACP adult count that we found in that 2-week cycle.
The egg/nymph infestation is the BLUE PERCENTAGE in the lower left side of the box.
This information tells a grove manager whether or not ACP are reproducing at the moment and can help guide them on what to spray.
If all counts (both adult and egg/nymph) are zero’s, then the box is GREEN.

